
Java goes to Kubernetes
Last year I had the opportunity to work on migrating Java microservices from EC2 to Kubernetes. It was mostly a smooth process thanks to the work that the OfferUp DevOps team had put in. The application deployment process that they created consolidated application properties, runtime, and ingress configuration. It was a big improvement over the legacy EC2 approach. Everything was great, except for performance. Various teams were reporting sporadic latency spikes and challenges with right-sizing.
The latency issues were caused by CPU limits tuned to average performance without taking into account the increased CPU usage during warm-up. Fortunately, Java warm-up is a topic that has garnered more attention in recent years, specially with the broad adoption of containerization and Kubernetes.
In short, CPU limits are enforced in Kubernetes through CFS. When an application exceeds its CPU limit, CFS will throttle the CPU usage of the application until the next period1 (100ms by default). During Java warm-up, the increased CPU usage can exceed the CPU limit, resulting in throttling that presents itself as latency for server applications.
Tracking down the root cause of this problem and researching possible solutions was really enlightening. These are my notes on what I learned, and some of the solutions I considered.
Startup vs. Warm-up
It’s easy to conflate these two, but they represent distinct phases in an application’s lifecycle:
-
Application Startup: This is the time it takes for an application to load and initialize. At the end of this stage, we would expect a readiness probe to pass. Optimizations here are focused on improving the Time to First Byte (TTFB)2. For cloud deployments, this also includes the time for infrastructure provisioning, like EC2 instance creation or Kubernetes pod scheduling.
-
Warm-up: This is the duration required for the runtime to reach its peak performance. In Java, this is dominated by the Just-In-Time (JIT) compiler, which is driven by method invocations, not just elapsed time. During this period, your service is running, but it’s also optimizing hot code paths, resulting in higher resource consumption.
Although this article is focusing on Java, these concepts are important to other languages as well. JavaScript in particular has seen a lot of improvements in startup and warm-up thanks to the research from projects like V8, the high-performance JavaScript and WebAssembly engine that is used by NodeJS. Their blog posts regarding the Maglev JIT and the Sparkplug compiler are fascinating, and reinforce the idea that these two metrics are an important KPI for many applications.
Class Loading
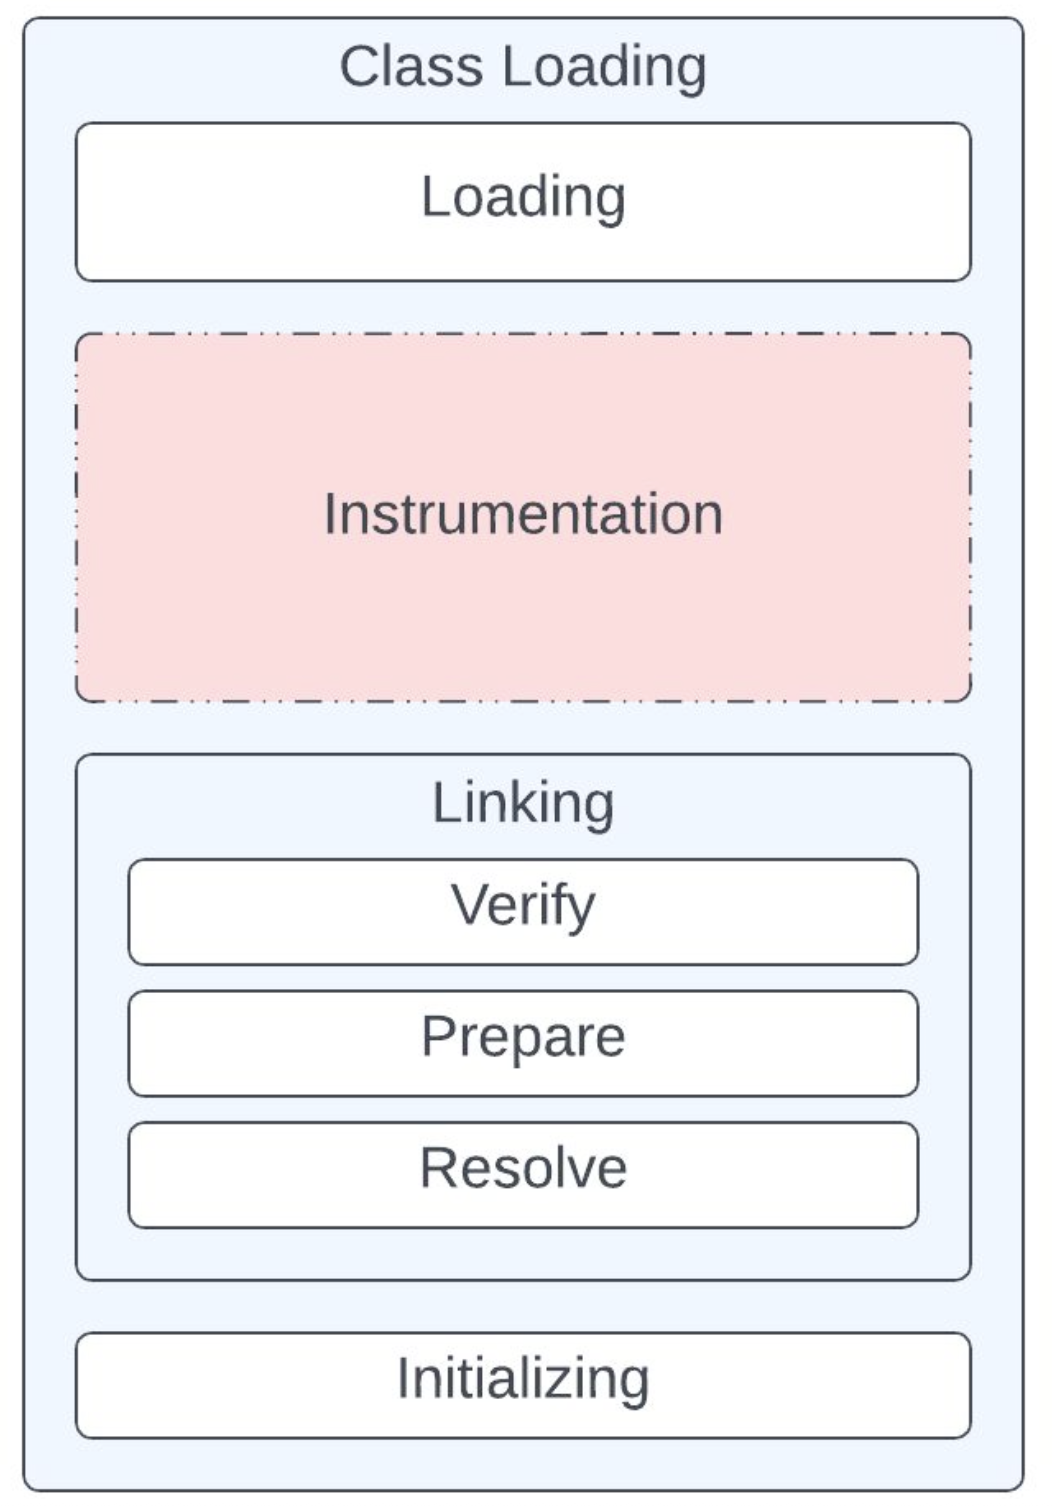
Loading is the process of creating a type (class or interface) from its binary representation. Linking is the process of taking a type and combining it into the run-time state of the JVM. Initialization of a type consists of executing its initialization method3.
Linking is divided into three steps: verification, preparation, and resolution. Verification ensures the type is structurally correct. Preparation involves allocating memory needed by the type, such as memory for any class variables. Resolution is the process of transforming symbolic references in the constant pool into direct references4.
Java Agent instrumentation, i.e., rewriting class bytecode, happens before linking. 5
JIT
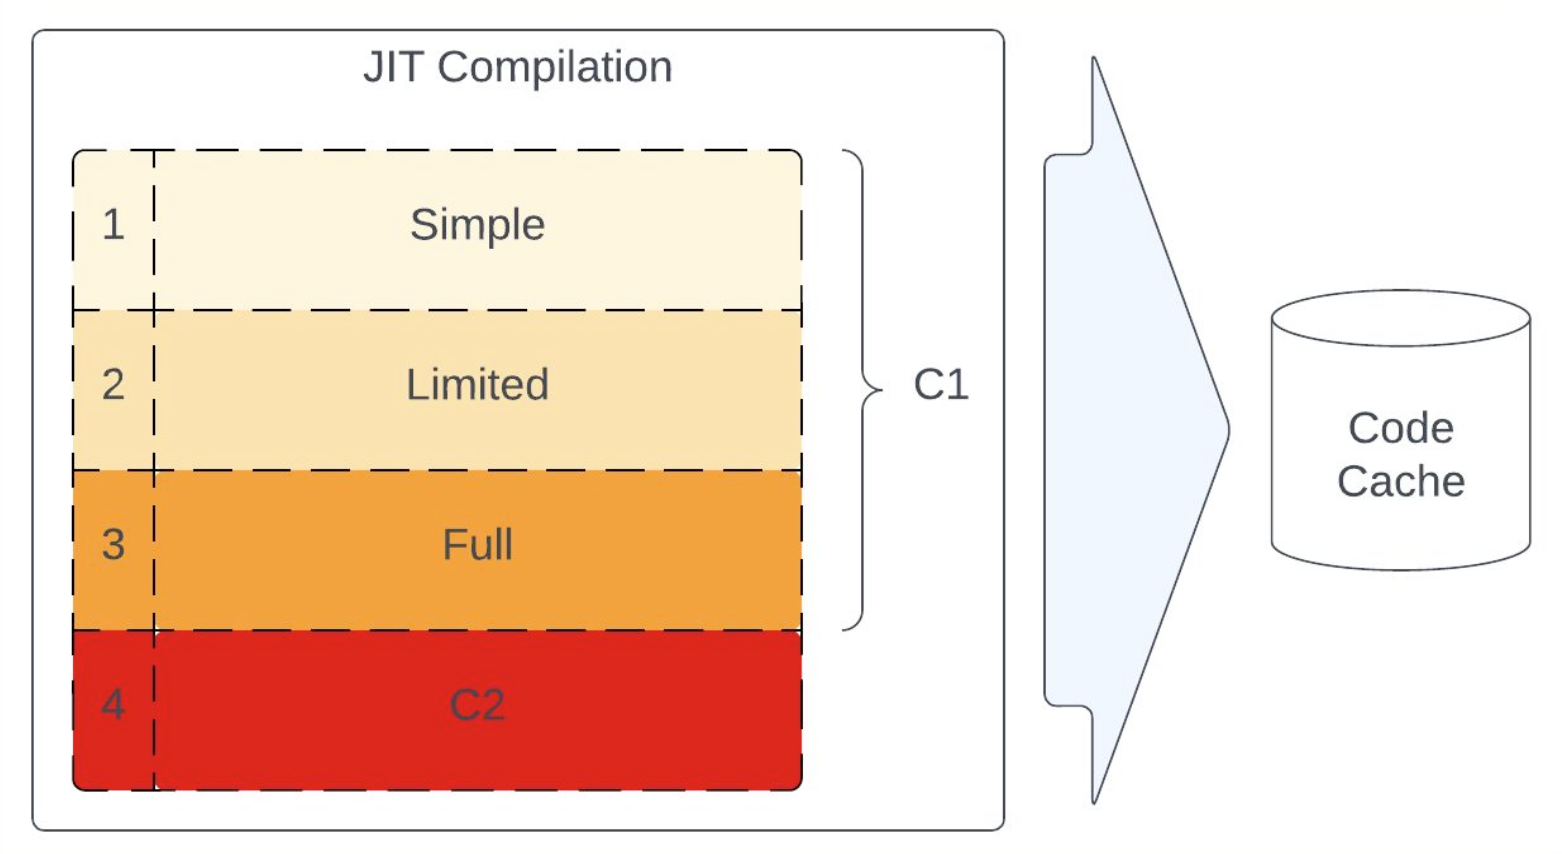
In the Java HotSpot VM, there are two separate JIT compiler modes, known as C1 and C2. C1 performs limited optimizations, is fast, and has a small footprint. C2, on the other hand, makes more aggressive optimizations, has higher resource demands, and produces potentially faster code6.
Even though the JVM works with only one interpreter and two JIT compilers, there are five possible levels of compilation. The reason behind this is that the C1 compiler can operate on three different levels. The difference between those three levels is in the amount of profiling done7.
Code Cache
The JVM generates native code and stores it in a memory area called the codecache8. Instead of having a single code heap, the code cache is segmented into distinct code heaps, each of which contains compiled code of a particular type: JVM internal code (compiler buffers and bytecode interpreter, stays forever), profiled code (lightly optimized, short lifetime), and non-profiled code (fully optimized, potentially long lifetime)9.
On-Stack Replacement
On-Stack Replacement, or OST, is the process of converting an interpreted (or less optimized) stack frame into a compiled (or more optimized) stack frame10. This makes it possible to compile hot loops independently of their containing method.
Deoptimization
The process of converting a compiled (or more optimized) stack frame into an interpreted (or less optimized) stack frame10. This typically happens when assumptions about profiled code change. In these cases, the current compilation of the method may need to be discarded and recompiled, or it may just be necessary to switch the execution to the interpreter7.
Optimizations
The following section briefly covers some of the techniques that can be used to improve startup, warm-up, and overall performance in a Java application.
Use Different JVMs




Although OpenJDK HotSpot VM is very common, there are other VMs available that might be more performant depending on the application.
Azul Platform Prime (formerly Zing) promises significant performance improvements, in part thanks to Falcon, their LLVM based JIT compiler.
Another JVM to consider is GraalVM, which brings the Graal compiler, a JIT compiler (written in Java itself!) that assures performance advantages for highly-abstracted programs11.
Last but not least, the OpenJ9 JVM from IBM has its own JIT compiler and touts higher start-up performance and lower memory consumption at a similar overall throughput.
Compile Remotely
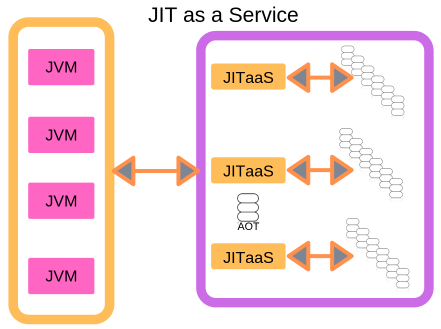
A more advanced solution is to offload the JIT compilation from the machine running the JVM.
The Azul Cloud Native Compiler provides this functionality for the aforementioned Azul Platform Prime, and it’s cloud native!
If you prefer open source, maybe consider OpenJ9 JITServer instead, which provides the same functionality for the OpenJ9 JVM.
Reuse Profiling
For cloud native applications, restarts are a common occurrence due to horizontal scaling12 and cluster optimizations13. In these scenarios, reusing the profiling data from previous executions would allow the JIT compiler to skip ahead to the proven optimizations, reducing warm-up time.
Project Leyden is OpenJDK’s answer to AOT and profiling reuse. Its AOT Method Profiling feature (JEP-515, released in Java 25) allows users to use profiling data from previous runs.
Azul Platform Prime also provides this functionality through Azul ReadyNow. Through their Optimizer Hub, profiling data is collected and optimized in a centralized location.
The OpenJ9 also accomplishes a similar trick through class data sharing. When class data sharing is enabled, Ahead-of-time (AOT) compilation is also enabled by default, which dynamically compiles certain methods into AOT code at runtime. Further performance improvements are gained by storing JIT data and profiles in the shared classes cache.
Don’t mind using Java 8? Dragonwell8 JVM from Alibaba provides something called JWarmup, a feature that reuses profiling data from previous runs and compiles the hot methods earlier. Notably, this feature was proposed upstream but closed in favor of Project Leyden.
Honorable mention: The OpenJDK CRaC project (Coordinated Restore at Checkpoint) reuses the entire application state, not just the profiling data. By leveraging Linux’s checkpoint/restore feature, CRaC can snapshot an application and then reuse the snapshot multiple times, reducing the time to load and initialize the application on every run. Unfortunately, CRaC has an adoption problem: it requires tight integration with the CRaC API and is only supported in Linux.
Optimize Class Loading
Packaging only what is needed in container images can reduce startup times in a cloud environment. In the context of Java applications, this functionality is available via jlink, a tool that can create a custom run-time image with just the classes that the application needs.
In a similar vein, HotSpot’s AppCDS allows a set of classes to be pre-processed into a file that can then be memory-mapped at runtime to reduce startup time. OpenJ9 provides the same functionality via the aforementioned class data sharing feature.
Use Virtual Threads
Virtual Threads were released in Java 21 and promise to improve performance in high-concurrency applications like servers. Notably, something similar to “virtual threads” has been available to users of the Dragonwell JDK for a while via Wisp2.
Avoid Reflection
Reflection in Java is a really powerful concept, and it’s used in many popular libraries. Unfortunately, it does come at a cost.
- Using Jackson? Use Jackson Blackbird, the successor to Afterburner. Not only does it address the use of deprecated APIs, it also uses the LambdaMetafactory, which can improve invocation performance14.
- Mapping objects? Check out MapStruct. It generates object mappers at compile time and is highly customizable.
- Scanning lots of classes? ClassGraph has support for build-time scanning.
Other Tips
- Limit scaling
- Limit traffic exposure to young VMs
- Resolve dependency injection